1111IESPDJ/E+ via Getty Images
I’m a natural saver.
I get strong satisfaction and a sense of security from being able to stash away money every month, investing most of it into dividend growth stocks that further my passive income snowball.
That makes spending money hard, even painful at times. Intellectually, though, I know that the purpose of my accumulated wealth and passive income is to be wisely stewarded and enjoyed.
I wrote a lot more on this subject in my New Year’s post, “Investing In The Good Life.”
Ample scientific research has shown that money or wealth in itself is not what engenders a happy, fulfilled life. But using one’s wealth to invest in the various elements of a good life, such as close relationships and time in nature, does tend to promote the good life.
My wife and I recently did just that, having traversed Scotland from Edinburgh to the Isle of Skye over the last few weeks. We saw 12 castles, ate fantastic food, and hiked through some stunning, otherworldly landscapes in the Highlands.
Happiness is made possible by the realization that some things in life are more valuable than money.
With that said, another element of the good life is meaningful work, so I’m glad to be back in the saddle.
Here’s this week’s agenda:
- Shifting narratives: From “how many rate cuts?” to “maybe more rate hikes?”
- More evidence that the economy remains in disinflationary mode.
- The economic drag from fiscal largesse.
- The 9 dividend stocks on my buy list this week.
Shifting Narratives: Will He Or Won’t He (Cut Rates)?
Benjamin Graham, the Father of Value Investing, said that stock pricing is a voting machine in the short term but a weighing machine in the long term. I wonder what he would say about the current environment, in which the market is overwhelmingly swayed by the movement of interest rates and interest rates are moved by expectations of Fed actions.
The latest reversal in the market rally, especially for rate-sensitive sectors like real estate (VNQ) and utilities (XLU), came from the release of Fed meeting minutes that revealed some openness to tightening policy further if the inflation data justified it.
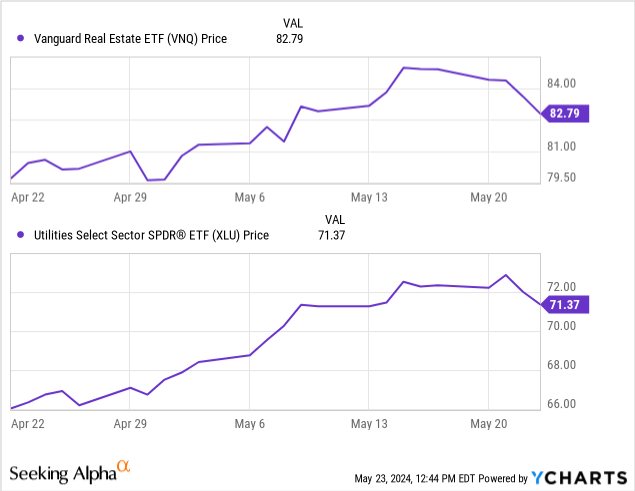
You can see the result of the Fed minutes release on May 22nd.
“Oh no! The Fed is more hawkish than we thought!”
My frustration is not that stocks are moved by interest rates. That’s reasonable.
My frustration is that interest rates are so heavily moved by a small cabal of monetary technocrats that keep dropping conflicting hints about what they’re going to do next.
On the flipside, this hasty shift in market narrative has pulled down the prices of some high-quality dividend stocks I want to accumulate more shares of, so there’s a silver lining.
Weakness Under The Surface
I attest that the economy remains solidly in disinflationary mode and that official inflation metrics should continue to come down from here.
Let’s look at some underlying data.
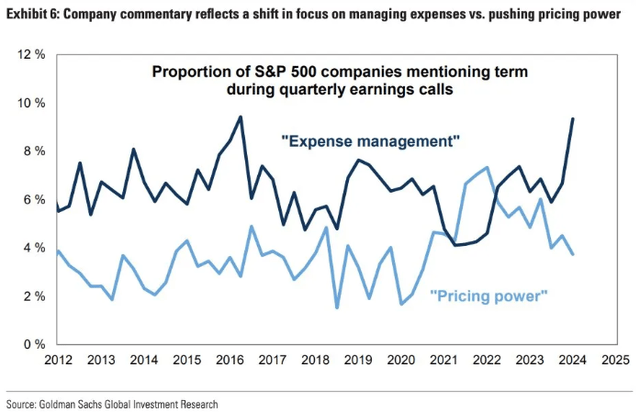
For example, the large corporations in the S&P 500 (SPY) experienced a brief shift in focus from controlling expenses (in the 2010s) to pricing power in the post-COVID years, and now expense management is making a resounding comeback.
Goldman Sachs
Tamping down on expenses means less business spending. Less business spending typically means less upward pressure exerted on inflation.
Meanwhile, mention of pricing power is declining rapidly.
Some folks like to bring up the NFIB Small Business Survey showing a slight increase in the number of small businesses planning price hikes. Pish posh. The pricing plans of Walmart (WMT) and Amazon (AMZN) matter far more than what small businesses plan to do. Walmart has been rolling back prices this year. Target (TGT) is following suit by lowering prices on 5,000 popular items. And Amazon Fresh is cutting grocery prices for private label items at its stores.
I think this is just the beginning.
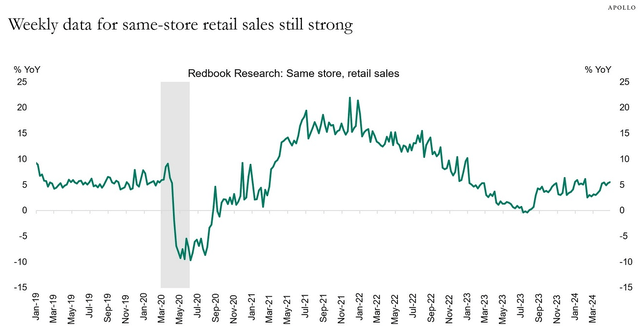
You might look at a chart like this one, showing same-store retail sales rebounding back to their pre-pandemic average level, and assume this means that consumers remain strong.
Torsten Slok
But historically, retail sales growth has come from a fairly even mix of price hikes and volume/unit growth. In other words, people were buying more stuff, not just more expensive stuff.
But over the last two years, price hikes have caused consumers to pull back on the volume of stuff they buy. They’re taking items out of their carts and putting them back on shelves, so to speak. We know this because real retail sales have been slightly negative the last few years.
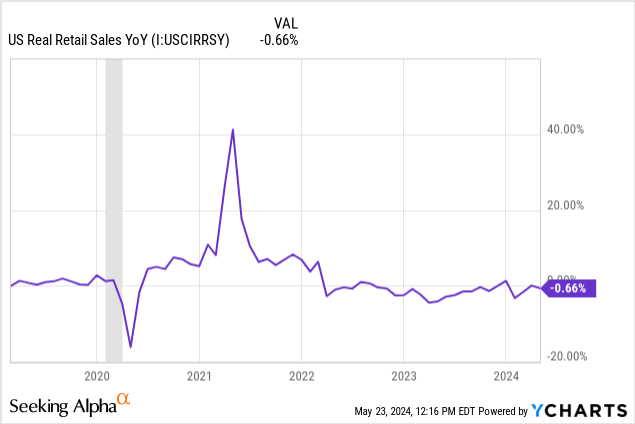
Same-store retail sales growth of ~5% is a result of price hikes offsetting volume declines. This situation can’t last forever. Eventually, retailers need to return to volume growth, which is exactly why we’re seeing the likes of Walmart, Target, and Amazon lead the way on reversing some of these price hikes.
It’s the same story with food.
Below we find the YoY growth in “food at home” (blue line) and “food away from home” (red line), the latter of which (basically restaurant menu prices) is still lingering over 4%.
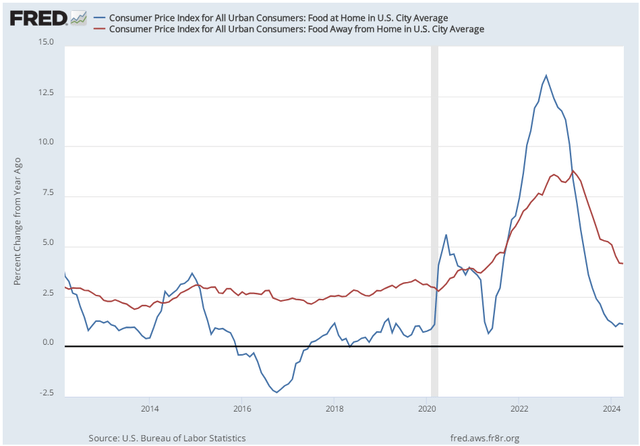
St. Louis Fed
Does this signify an abundance of financially strong consumers still happy to spend money out at restaurants?
No, not really. According to the National Restaurant Association, a far greater number of restaurants have reported declining customer traffic over the last year than increasing traffic.
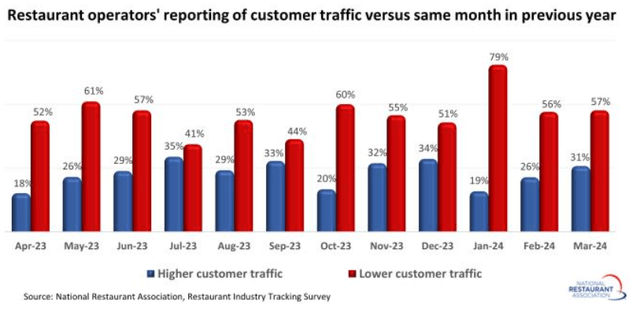
National Restaurant Association
Consumers are making fewer trips to restaurants and/or ordering fewer menu items when they do.
According to National Restaurant Association data, menu price hikes were enough to more than offset falling traffic last year. But from January through March this year, same-store sales (on a nominal basis) have turned negative for the majority of restaurants.
This seems like a recipe (pardon the culinary pun) for further disinflation.
The Fiscal Death Spiral
US government debt is approaching $35 trillion. That’s about $11 trillion higher than immediately before COVID-19 began.
Like King Theoden from Lord of the Rings, I’m wondering, “How did it come to this?”
And more importantly, “What effect will this have on the economy?”
Fed Chairman Jerome Powell (notably, a monetary rather than fiscal policymaker) says US deficit spending and debt are on an “unsustainable path” and that “elected people need to get their arms around this sooner rather than later.”
The fiscal situation was already bad before COVID. Now it’s leaps and bounds worse.
It’s hard to overstate the magnitude of the fiscal response to the pandemic, along with the spending bills that followed it.
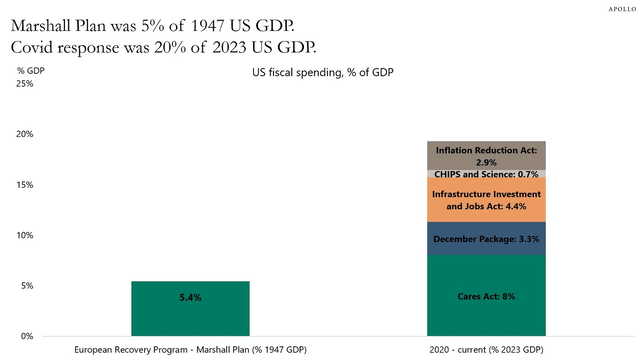
Torsten Slok
The $13.3 billion Marshall Plan — funding provided to rebuild Western Europe after World War II — faced lots of opposition in Congress for being “wasteful” and “extravagant.” The bill largely passed because of Republicans’ desire to oppose the rise of Communist Russia.
Fiscal spending in the wake of COVID has been 4x larger than the Marshall Plan as a percentage of GDP.
Worse, though trillions in debt have been wracked up over the last several years from the government’s “heroic efforts,” the problem going forward is that widening structural deficits are coming from programs that no politician with a functioning sense of self-preservation is willing to touch.
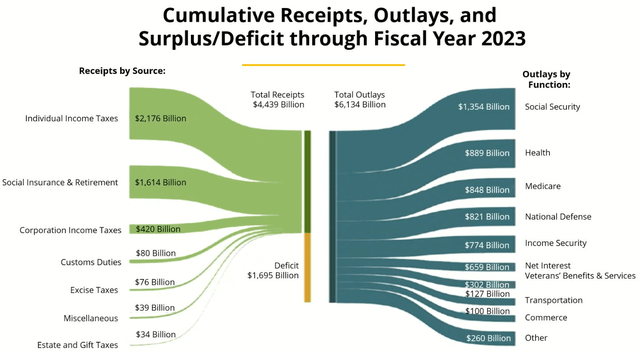
Chartr
As you can see, the vast majority of government spending goes toward Social Security, Medicare, Medicaid, defense, welfare benefits, and, of course, interest expense (currently the fastest growing line item in the budget).
Both political parties like to blame each other for this fiscal dumpster fire, but the truth is that this mess is a bipartisan creation. Deficits have steadily risen under Republican and Democratic administrations alike.
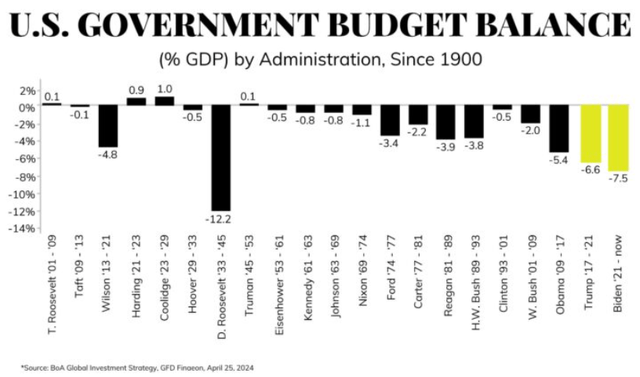
BofA Global Research
And though President Biden currently resides over the current escalation in deficit spending and hasn’t done anything to mitigate it, most of the increase in government outlays are either “mandatory” items (e.g. Social Security, Medicare, net interest) or areas where meaningful cuts are not politically feasible (e.g. defense, welfare, veterans’ benefits).
As I argued in “The Fiscal Death Spiral Has No End In Sight,” high deficit spending does not necessarily (or usually) cause either higher inflation or higher interest rates.
Rates are far more heavily influenced by the Federal Reserve than the Treasury Department.
We often hear the idea, even from very smart people like Stanley Druckenmiller, that high deficit spending crowds out private capital and causes interest rates to rise in the private sector, if not on the public debt side. But there’s strikingly sparse evidence that this is the case, especially in developed nations like the US.
But as I explained in “The Fiscal Death Spiral,” what this government spending can and does do is weigh down economic growth.
How? To wit:
Ultimately… greater government spending as a share of the economy has a negative effect on GDP growth primarily because of the nature of the spending. A larger and larger share of government spending is going toward uses and activities with low fiscal multipliers that produce a return on investment (measured by GDP) less than the cost of the spending.
A greater and greater share of economic output being used to fund non-productive government spending inevitably crowds out the nation’s limited real resources, thereby transferring capital from more productive activities to less productive activities.
Financing unproductive spending with debt just exacerbates the problem.
Now, could circumstances come together to produce a “bond vigilante” event in which the market attempts to enforce fiscal discipline on the US government by letting Treasury yields spike? It’s possible.
But despite lots of talk about the return of bond vigilantes over the last year or two, they remain nowhere to be found.
Count me skeptical that in an era where central banks, commercial banks, pension funds, and insurance companies are the largest owners of Treasuries, the bond vigilantes will be able to mount a comeback.
Never say never, I guess.
An Aside About Gold And Deficit Spending
Here’s a bonus segment — an interesting (at least I think so) correlation between the price of gold (GLD) and the level of deficit spending (as a percentage of GDP).
Sometimes I hear that gold is a hedge against inflation. Poppycock. It’s not an inflation hedge. There’s basically no correlation between the price of gold and inflation.
But there is a strong correlation between gold and deficit spending.
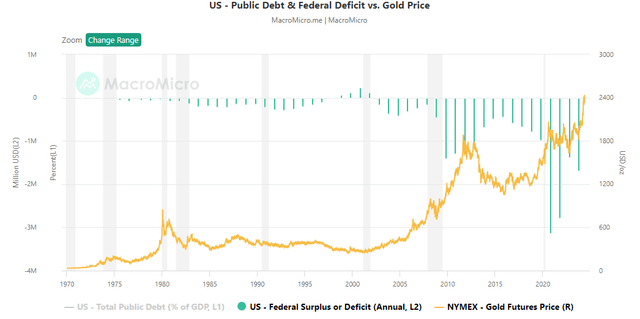
MacroMicro
Yes, the price of gold spiked in 1980, around the peak of inflation, but then it retraced back quite a bit into the mid-80s. Consumer prices did not pull back, though! That doesn’t sound like a great inflation hedge to me.
Also notice that gold basically didn’t move after the 9/11 terrorist attack. Instead, it began rising in the mid-2000s along with US deficit spending to pay for the wars in Iraq and Afghanistan.
Then, during and after the GFC, when deficits spiked to unprecedented levels, so did the price of gold.
When deficits moderated, the price of gold retreated. But then COVID-19 came around, deficits soared again, and so too did the price of gold.
I think gold is rising again this year because of election year political rhetoric and the increasing awareness of growing deficits.
Could a sustained rise in deficits translate into a sustained bull market for gold?
My Buy List For Late May
In lieu of persuasive evidence to the contrary, I continue to think that the economy is in disinflationary mode, which should eventually lead to falling interest rates — on the long end and especially on the short end of the curve.
By sometime next year, I would assume long-term rates are at least somewhat lower than today, but I think the Fed will cut enough times to bring the short end low enough to un-invert the yield curve.
Maybe this view will prove inaccurate, but it’s what I believe is most likely as of today.
That makes business development companies (BIZD) unattractive right now, because as the Fed Funds Rate and SOFR fall over the next year, so too should their net investment income.
Main Street Capital (MAIN) is a best-in-class, internally managed BDC and one of my top ten holdings. I’d be happy to own even more of it, but as of May 23rd, the BDC trades at a striking 162% of net asset value (“NAV”). My cost basis is at about 125% of NAV. Now, MAIN’s NAV per share is rising. It increased 8.5% YoY in Q1. But the stock price is currently up 22.5% YoY.
The same story goes for my second favorite BDC, Capital Southwest (CSWC). CSWC’s NAV per share in Q1 stood at $16.77, flat YoY while the stock price has soared over 38% YoY. This puts the stock price at 151% of NAV today. I own it at 119% of NAV.
I’m not selling my BDCs, but I don’t expect them to retain those premiums to NAV if my view of falling SOFR rates over the next year or so bears out.
On the other hand, while BDCs operate as lenders, real estate investment trusts (“REITs”) operate as borrowers. They would directly benefit from falling interest rates.
At the same time, the public real estate remains near its lowest allocation in investor portfolios in decades. Real estate is also around its lowest weighting in the S&P 500 since the GFC at about 2.2%
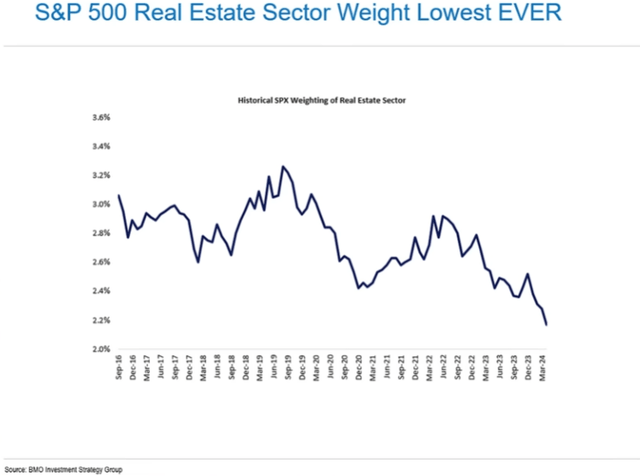
Brian Belsky, BMO Capital
This reminds me of when the energy sector’s weighting in the S&P 500 sank to around real estate’s current depths in 2020.
Back then, energy was the most hated sector of the market. Today, it’s real estate.
Hence why a little over half the dividend stocks on my buy list right now are REITs.
| Dividend Yield | 5-Year Avg Div Growth | Upside To 5-Year Average Valuation | |
| Agree Realty (ADC) | 5.1% | 6% | 33% |
| American Tower (AMT) | 3.5% | 15% | 40% |
| Alexandria Real Estate Equities (ARE) | 4.3% | 6% | 63% |
| Bar Harbor Bankshares (BHB) | 4.7% | 7% | 0% |
| Cullen/Frost Bankers (CFR) | 3.6% | 7% | 18% |
| Comcast (CMCSA) | 3.2% | 9% | 47% |
| InvenTrust Properties (IVT) | 3.7% | 4% | N/A |
| Rexford Industrial (REXR) | 3.8% | 19% | 75% |
| Essential Utilities (WTRG) | 3.3% | 7% | 41% |
I’ll note here that 5-year average valuations include both the elevated multiples of 2021-2022 and the depressed multiples of the last year or so. It also includes the brief selloff during the initial stages of COVID-19. So, comparisons to 5-year average valuation multiples is fairer than you might at first think.
Now, for REXR, the valuation highs from 2019-2022 truly may not be attainable again given that Southern California has lost some of its shine in the post-COVID era as lots of people and businesses have left California. That said, REXR still boasts a 45% mark-to-market on in-place rents, and once leasing demand makes a comeback, SoCal’s “virtually incurable” industrial supply shortage should serve REXR well.
Alright, here’s my brief pitch for each:
Agree Realty
ADC’s unbending commitment to quality in terms of both its portfolio and balance sheet have historically facilitated a virtuous cycle in which the REIT issues low-cost capital and invests it into top-tier, single-tenant retail properties.
In Q1, ADC turned in 4.6% AFFO per share growth and issued guidance for 4.2% growth for the full year. Not bad, all things considered!
The combination of defensiveness and growth offered by ADC goes a long way in explaining why it is my largest holding. The monthly dividend is icing on the cake.
American Tower
After Crown Castle’s (CCI) recent fall from grace, AMT is the undisputed leader in wireless communication infrastructure around the world. It owns and builds cell towers as well as data centers thanks to its recent acquisition of CoreSite. While CoreSite’s hybrid data centers don’t directly benefit from the mass adoption of AI programs, management believe there will be indirect benefits as AI applications become more widespread.
Like CCI, AMT is working through some churn from Sprint, which was acquired by T-Mobile several years ago. That creates a mild headwind that should resolve over the next year or so.
Meanwhile, AMT’s sale of its India towers business to Brookfield/Brookfield Infrastructure (BN, BAM, BIP, BIPC) is helping the REIT to achieve its deleveraging goal of <5x EBITDA faster than management initially thought.
With a strong balance sheet, ample growth opportunities across the globe, and lots of valuation upside, AMT remains a high-quality growth REIT to buy.
Alexandria Real Estate
ARE owns and develops Class A life science mega-campuses in the nation’s most productive research clusters like Boston, San Francisco, San Diego, and Raleigh/Durham. It has established a long history of thought leadership and growth in this space such that top biotech tenants generally seek out space in an ARE campus before looking elsewhere.
The market worries about the cyclical slowdown in tenant leasing after the red hot post-COVID years. ARE should endure this just fine with minimal disruption. Its weighted average remaining lease term is around 8 years, and its annual rent escalators are around 3%.
The market also seems to worry about the amount of new life science supply hitting the market. But most of this spec space does not directly compete with ARE’s state-of-the-art facilities within highly productive research clusters. The best biotech companies want to be located in the best research campuses. Generally speaking, price is a less important factor than location for companies thinking about where to conduct their R&D.
Bar Harbor Bankshares
BHB is a small regional bank in New England, headquartered in its namesake town of Bar Harbor, Maine. Admittedly, the stock has a sentimental value to me, because my wife and I have visited the town a few times in order to hike in nearby Acadia National Park.
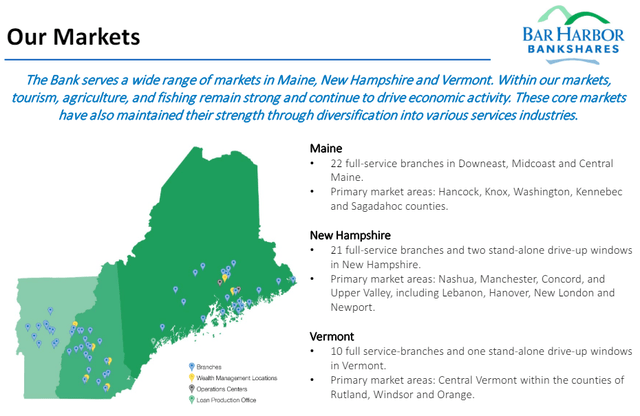
Bar Harbor Bankshares Presentation
All sentiment aside, though, BHB is a well-managed bank with a strong history of organic and acquisitive growth as well as dividend growth (20 consecutive years of growth, 30 years without a cut, and seven straight years of 7%+ hikes).
Other signs that BHB is a well-run regional bank are the facts that loan non-accruals remains low at 0.23% of the total loan book (conservative underwriting) and that total deposits remain near all-time highs (customer loyalty), unlike many regional banks that have seen deposit outflows.
Also, BHB pays out only about 45% of its earnings, creating a nice buffer for its dividend.
Cullen/Frost Bankers
CFR is another conservatively managed regional bank, except it is far bigger than BHB. It is the largest regional bank in Texas and solely concentrated in the Lone Star State.
Like BHB, CFR boasts an impressive dividend growth record (30 consecutive years), strong customer loyalty, and conservative underwriting with minimal losses over its history. As another sign of its conservatism, the bank has established a pattern of holding about 20% of assets in cash, ready to pounce on the rare, attractive investment opportunities (loans, securities, M&A, etc.) that may come its way.
Today, that cash level is down to 17% of total assets, which I assume means that CFR is opportunistically deploying cash by locking in relatively high yields for long periods of time.
Comcast
Led by CEO Brian Roberts, the second generation of the founding family, CMCSA is now a multi-media and communications conglomerate with assets across broadband/WiFi, cable TV, streaming, cinematic entertainment, and world-class theme parks. It may sound like a cobbled together mix, but I believe management does a good job of finding synergies across them.
That said, this diversification also exposes CMCSA to competition from many angles, forcing it to keep investing in each space to remain competitive. For example, CMCSA lost some 65,000 broadband customers in Q1, because wireless carriers’ fixed wireless offerings are eating into their business.
CMCSA is taking steps and creating new products to fend off its competition, but these lower-cost products (like the StreamSaver bundle) may not be as profitable.
The good news is that CMCSA generates a ton of free cash flow with which to invest for the future, repurchase stock, and grow their dividend.
InvenTrust Properties
IVT is a high-quality Sunbelt grocery-anchored shopping center REIT. Its quality stems from both its portfolio of well-located essential retail in fast-growing cities as well as its low-leveraged balance sheet and 4.8x net debt to EBITDA.
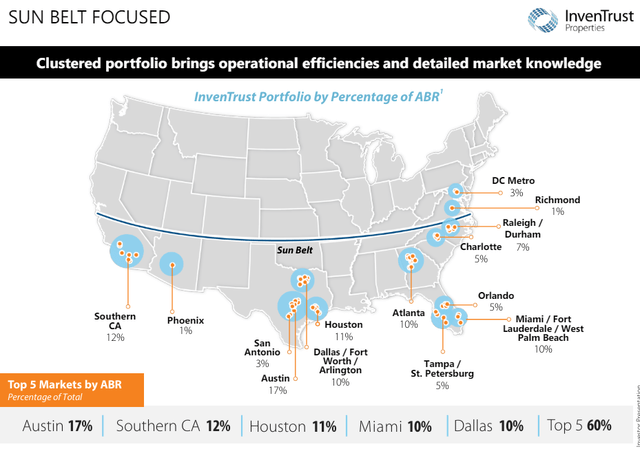
IVT May Presentation
Note the concentrations of IVT’s properties above and compare them to the projected growth rates of the fastest growing markets (by retail real estate NOI) over the next 4.5 years:
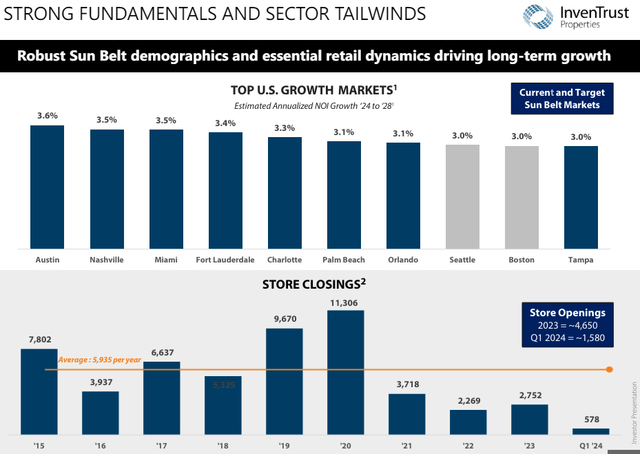
IVT May Presentation
Notice also that after retail store closures peaked in 2020, they have been minimal thereafter. Retailers that couldn’t survive in an omnichannel world have mostly ceased to exist, and now the retailers leasing space from the likes of IVT are stronger and more resilient than before.
IVT’s portfolio sits at record occupancy of 96.3%, and IVT has guided for best-in-class same-store NOI growth this year of 2.75% to 3.75%.
Rexford Industrial
REXR’s valuation of 18.9x core FFO is a far cry from its >35x multiple from years’ prior. It seems to assume that REXR’s growth story is basically over, that industrial tenant demand in Southern California isn’t coming back to the same level as it was until the last several quarters.
But management believe they should return to double-digit growth next year, and I see no reason to doubt them. Net absorption in SoCal has indeed been bad lately, but REXR’s portfolio has held up better than the average industrial facility. That speaks to its quality and functionality.
I believe in SoCal! I believe in REXR!
Essential Utilities
WTRG enjoyed a nice rally recently alongside the pullback in interest rates, and now it has fallen back down amid the aforementioned Fed hawkishness panic. That’s fine. I needed to keep building my position anyway.
This Pennsylvania-based, regulated water and gas utility is the opposite of sexy, but its strong balance sheet, A- credit rating, conservative management, and growing investment pipeline provides confidence in its continued ability to grow like clockwork going forward. Operating in favorable regulatory territories and continuing to pursue municipal water acquisitions when available, I think the 32-year dividend growth streak should keep extending into the future.
Water doesn’t get much more defensive!
from Finance – My Blog https://ift.tt/i6haRPZ
via IFTTT

No comments:
Post a Comment